Weekend Charts - Broad Markets
Broad Market Indices
QQQ - Weekly Chart with 200 week moving average (MA)
Right back where we were in June. This is it right here. We can see what happens when it breaks the MA, and what happens when it doesn’t. No guessing needed.
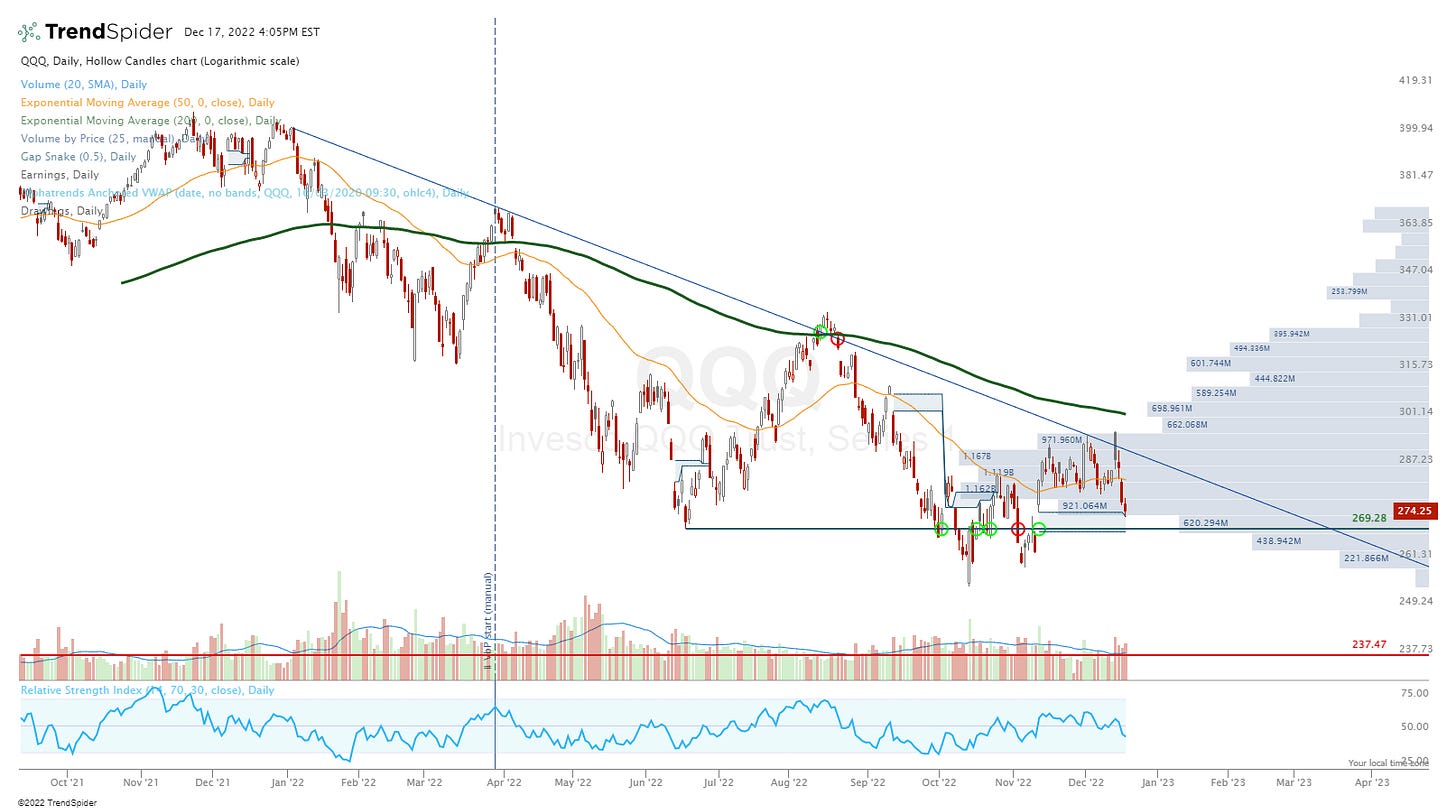
QQQ - Daily
Perfectly coincidental that the daily lows would touch the gap zone from early November (which has price memory to the June low). Trendline since Jan 4 remains in place. Fake outs above haven’t lasted.
A tactical trader could eye that gap zone, and play a bounce off it into that trendline. If we wakeup Monday inside it, all bets are off.
DIA - Daily
Tactical trading is about finding favorable risk/reward setups (similar to playing premium hands in poker or knowing when to hit or stand in blackjack). The Dow touched its 200 exponential moving average (EMA), and closed Friday’s session just above the YTD down trendline. Risk/Reward on the long side is above these, and on the short side below. Simple, well established reference points.
SPY - Daily
I referenced the November gap zone when discussing the QQQ. Well the SPY is firmly inside of its. Is it front-running next weeks price action for the QQQ? I don’t know. But the move from here provides information. It’s difficult to be net long below such a pronounced downward trendline and below a 200day moving average. You can certainly be tactical (meaning, looking for short term spots to ride the up sequence into past resistance) but for set it and forget it investors, it’s not time to be buying dips.
IWM - Small Caps - Daily
I’m once again going to point to the November gap zone (shaded grey below) in discussing small caps. They’ve blown right through it and look to be headed towards prior lows from both June and October.


