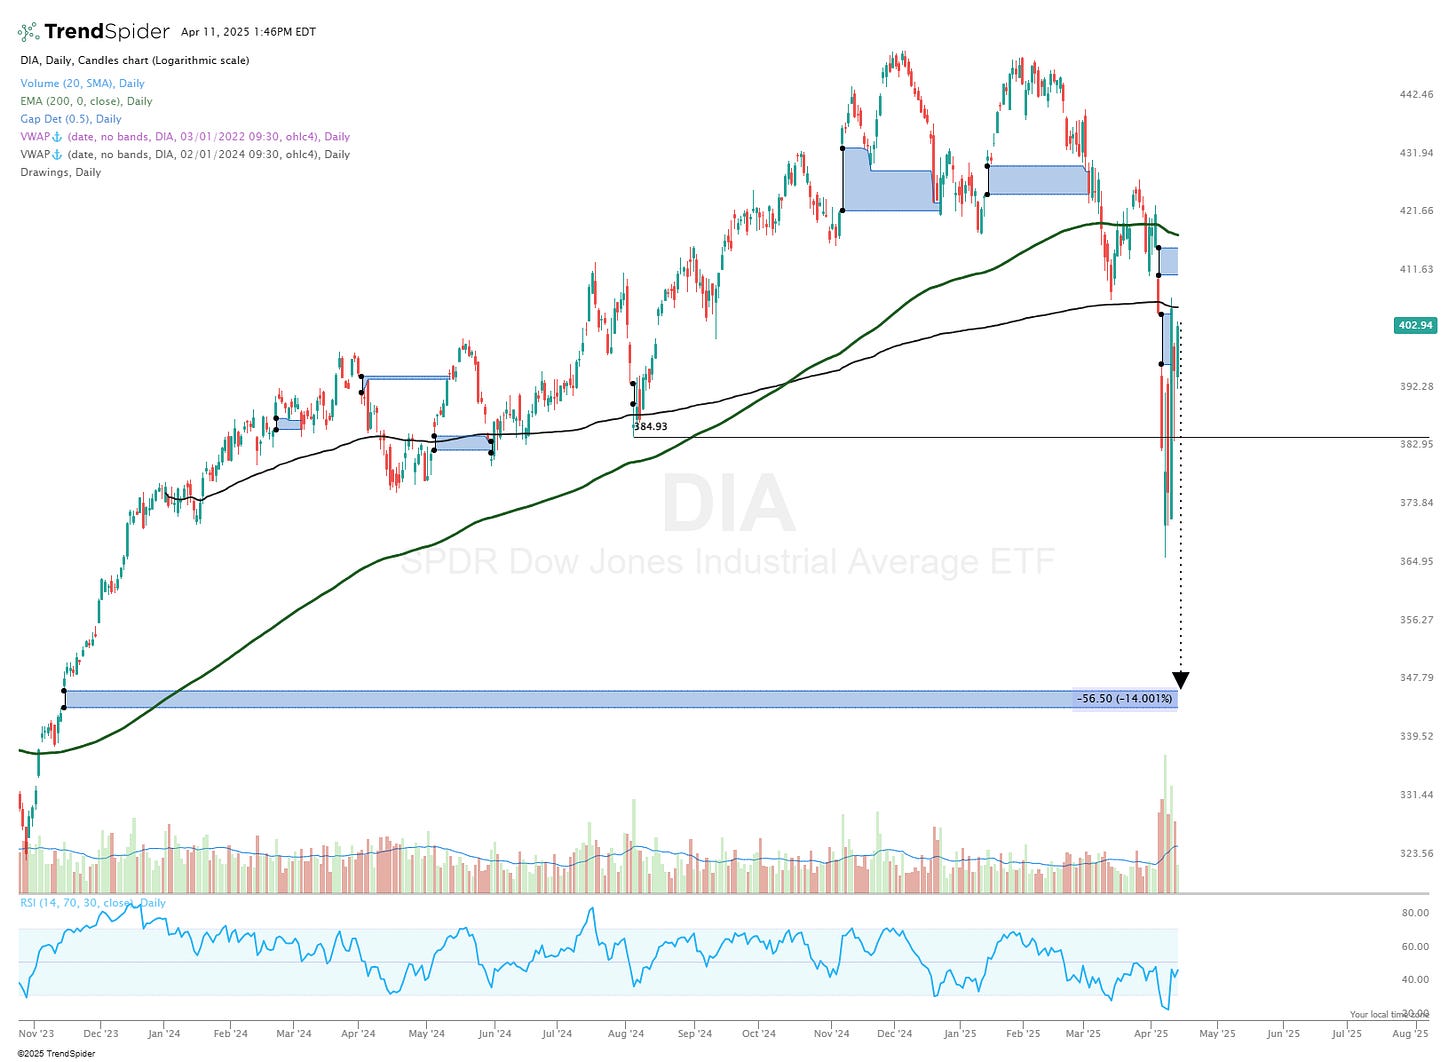
Few charts to put the broader equity markets into context -
SPY 0.00%↑ with a ruler line down to Nov ‘23 unfilled gap -
QQQ 0.00%↑ with a ruler line down to Nov ‘23 unfilled gap -
DIA 0.00%↑ with a ruler line down to Nov ‘23 unfilled gap -
IWM 0.00%↑ with a ruler line through the Nov ‘23 unfilled gaps, ending at an unfilled gap that goes back to May ‘20.
This is the most important chart for me. Small caps have led the way down, and bounced off the Nov ‘23 gap range this week. This suggests to me that a similar path is likely what’s in store for the SPY 0.00%↑ QQQ 0.00%↑ DIA 0.00%↑ over the coming days/weeks.
Should IWM 0.00%↑ breach the 2023 gaps, it would open the possibility for a move towards the 2020 range. While that wouldn’t be catastrophic percentage move for small-caps, it would be for the other indices, which have similar unfilled 2020 gaps much much lower. Approaching those ranges is downside scenario I do not want to fathom at this stage.


