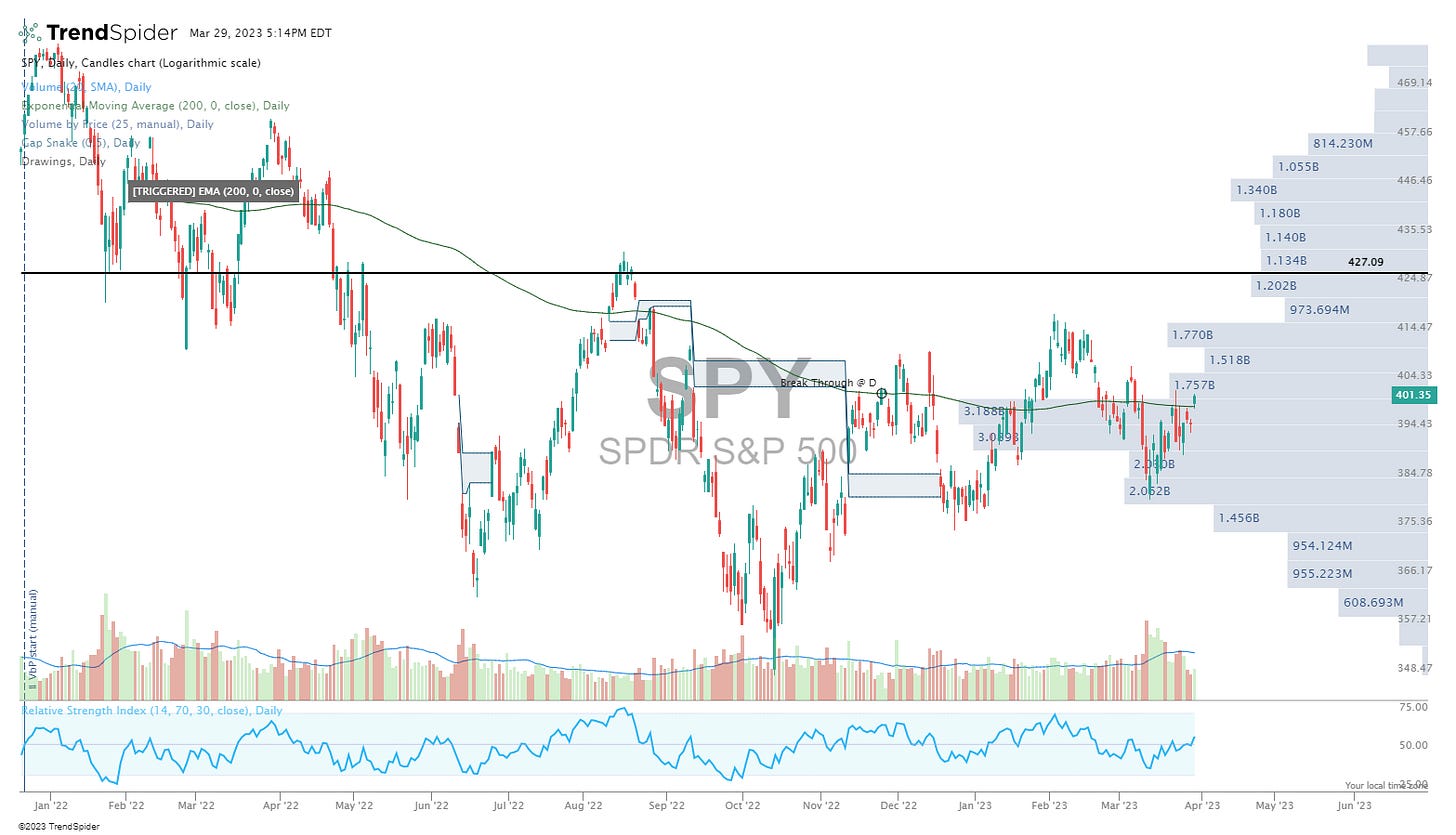
$SPY Update
My apologies
I appreciate you reading, and apologize for the infrequency of charts as of late, though admittedly, it’s been somewhat intentional. I plan to do a broad market recap after quarter close this Friday, but this is the chart I’ve been most fixated upon. SPY 0.00%↑ is back above a flat 200 day, and with two days left in the week, I have no idea whether it ends above or below. In a market where SPY 0.00%↑ is below a flat 200 day, I tend to make less trades on the long side. Now GLD 0.00%↑ is certainly doing its job of late, and there are some single stock setups which are looking attractive (more to come on those). But I’m really just sitting on my hands to see if we can close the week, month, and quarter above that 200 day, as the relevancy of such would certainly be a positive development.

