The monthly SPY 0.00%↑ chart doesn’t look great (bear flag?)
Zooming in, we’re above a flat 200 day. Not a bad thing, and there’s an unfilled gap up near $420.
We’re also at a relatively low % of stocks below their 50 day moving average. The SPY 0.00%↑ typically snaps back when we get down near these levels, but the story in Q1 has been the concentrated outperformance from the big names.
Mega-caps stole the show in Q1
But were a gross underperformer in 2022. Merely a case of mean reversion?
And consider this -
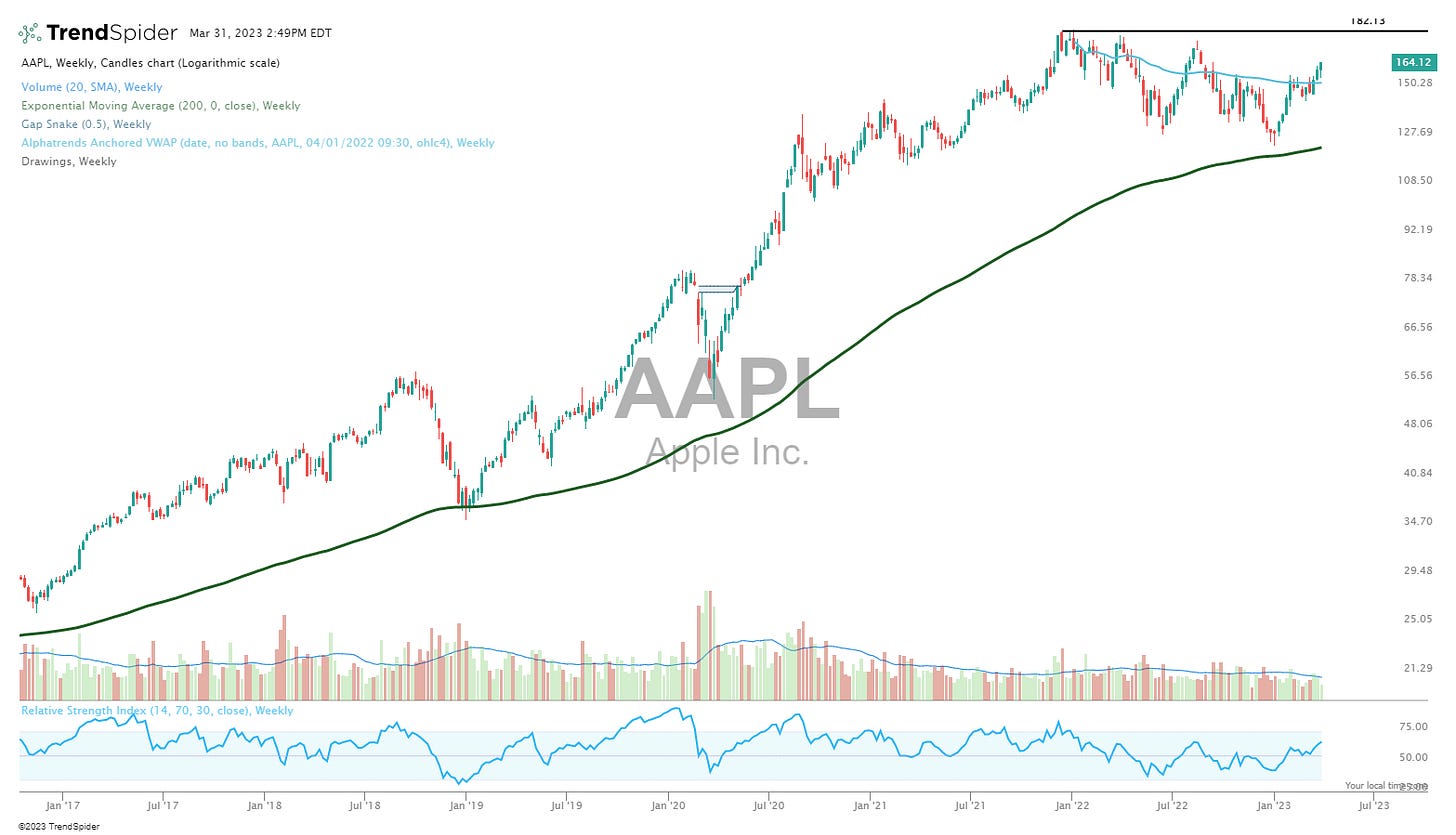
AAPL 0.00%↑ has been moving sideways for awhile
MSFT 0.00%↑ could have many natural sellers at these upcoming price levels
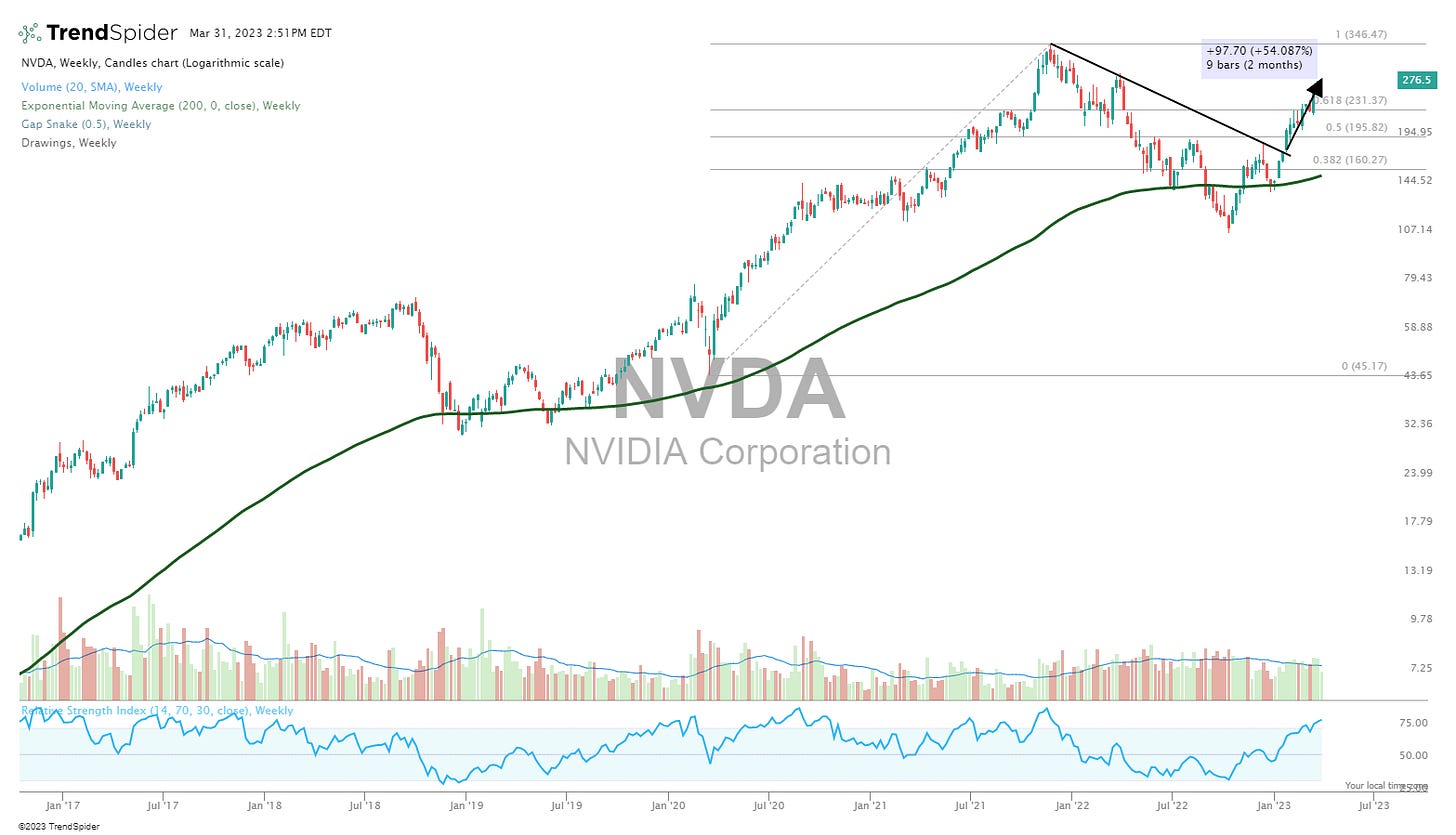
NVDA 0.00%↑ is up 54% this year.
Small caps don’t look particularly well in the aggregate.
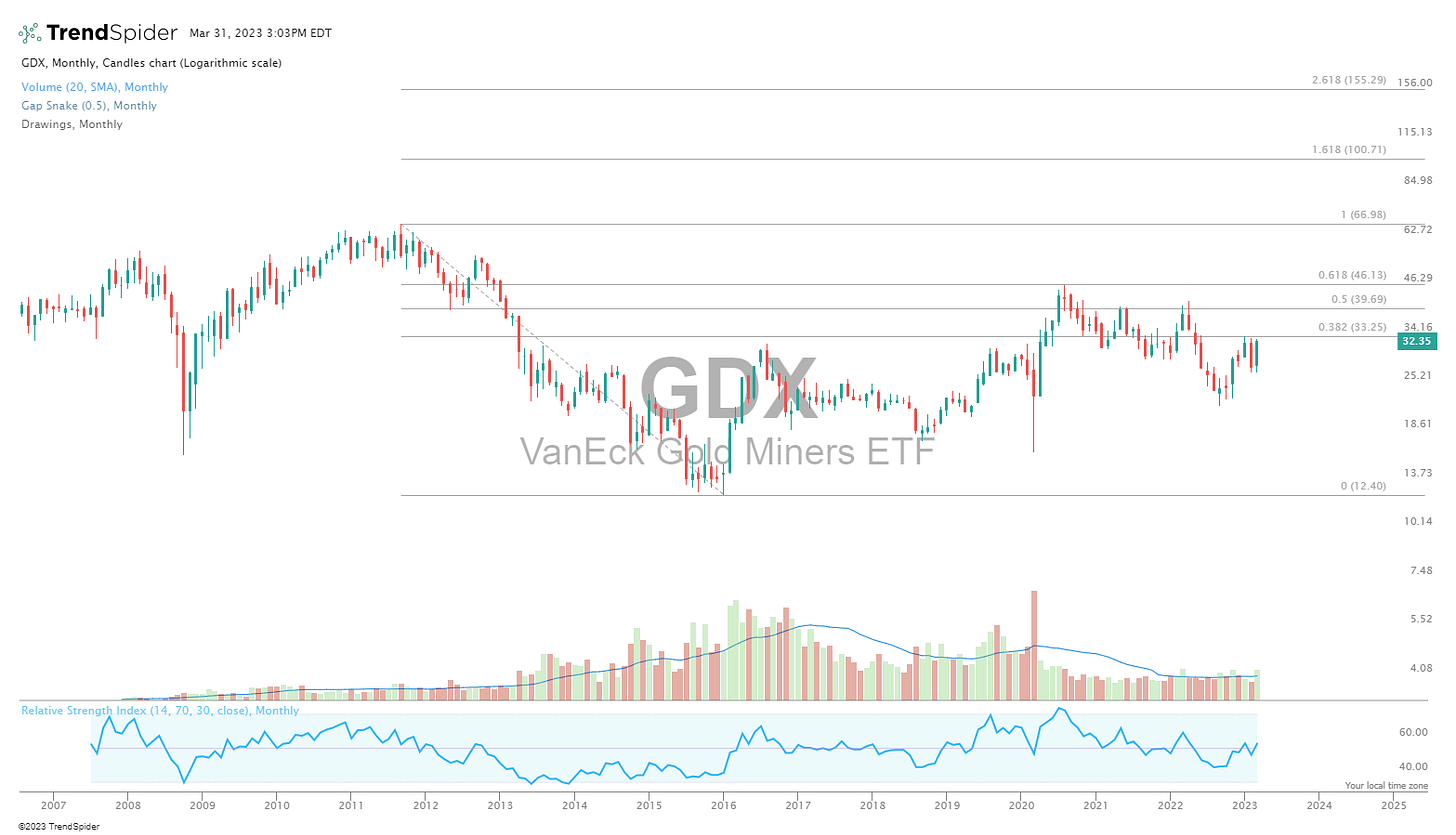
Gold’s working. Looking to see this one break and hold $2,000. ETF’s to consider - GLD 0.00%↑ , PHYS 0.00%↑
I prefer the miners GDX 0.00%↑ . $27 looks like a solid floor on this one.
The outperforming ETF’s in Q1 again show the impact of mega-caps.
Banks, energy, healthcare, and utilities lead to the downside.
So what’s the takeaway from all of this? The mega’s worked in Q1, as perhaps that “flight to safety” given the headwinds brought on by several notable regional bank failures. But it feels like a case of too much weight on one side of the boat.
Consider this -
The TLT 0.00%↑ just booked its highest volume month since March 2020. Fed futures are now indicating rate cuts, and if that's indeed how this plays out, well the template for the indices is there for us. The megas have begun their move, might it be everyone else following their way in in Q2?


