NYCB Chart Update
$NYCB
Most recent post -
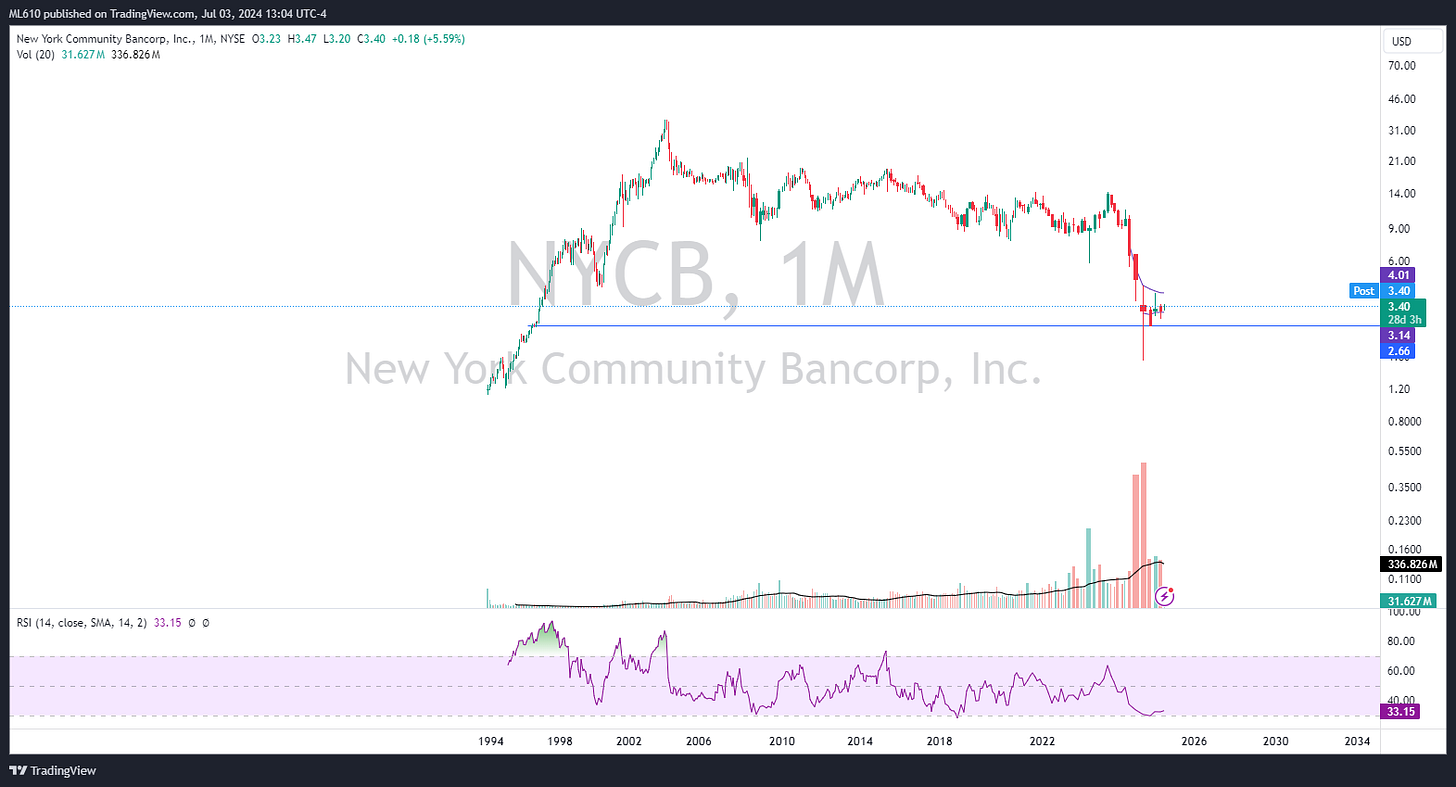
NYCB 0.00%↑ is reverse splitting 1:3 next Friday. The charts look interesting. First, the monthly -
The heaviest of the selling appears in the past. Momentum appears to be rounding off of the bottom.
Now the daily -
Price is currently wedged between the AVWAPs from the two most recent notable gaps down. There’s a favorable risk/reward trade between these two levels, as well as above the higher AVWAP, if/when the stock clears that hurdle. A break above the higher band would introduce the upside of some sort of gap fill up above.
Certainly worth a look…


