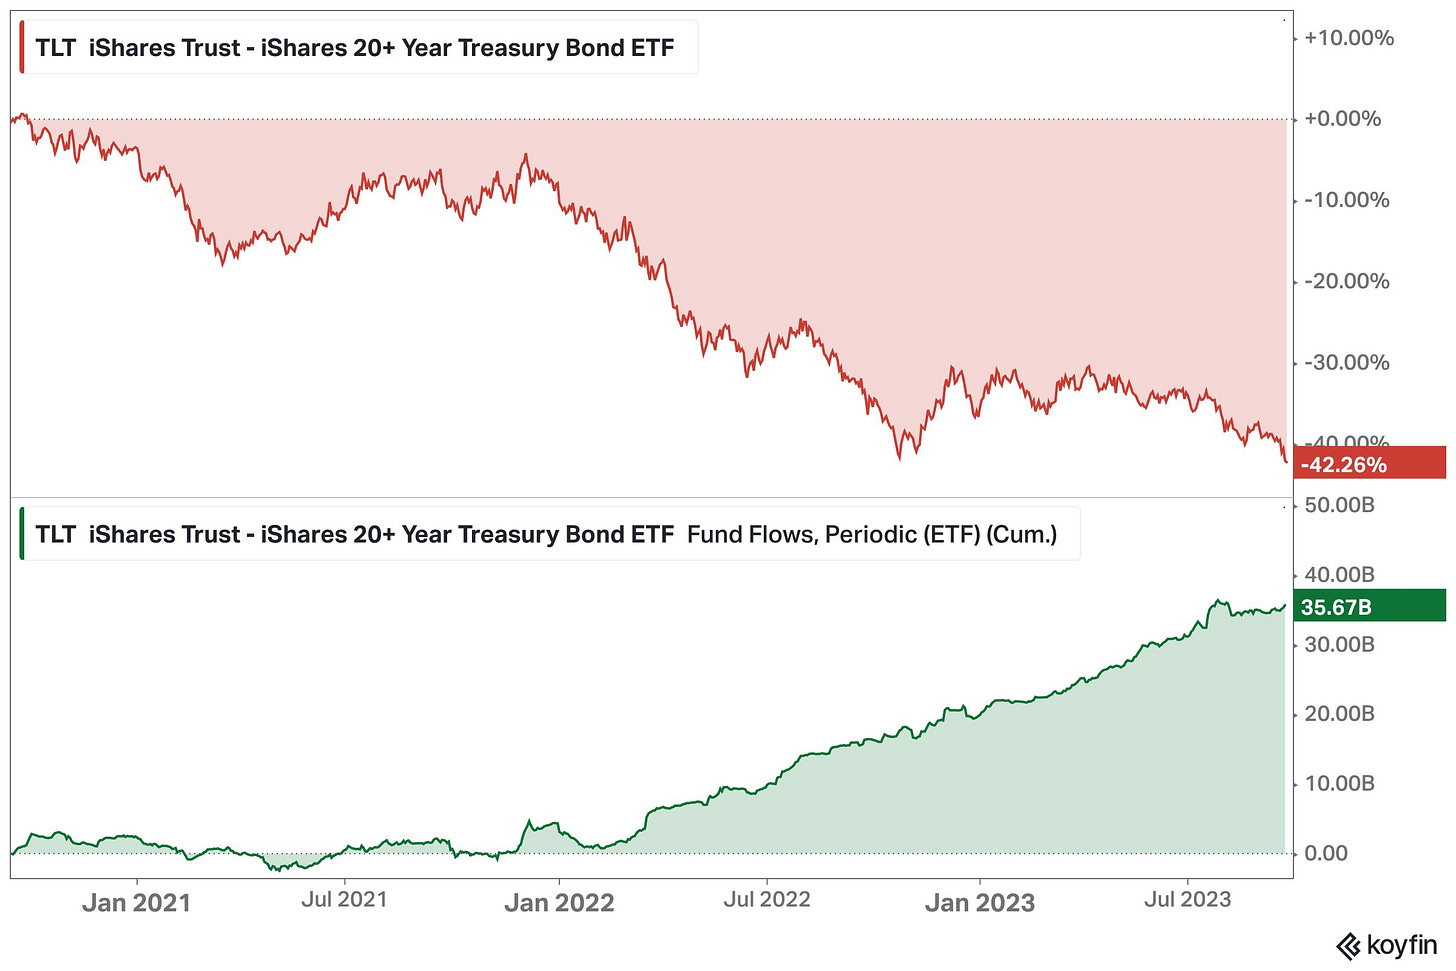
Here’s an interesting comparison from Koyfin re: the TLT 0.00%↑ . While the 20 year bond ETF has spent the majority of the past 18 months in a downtrend, investors have been piling in.
I wrote about a potential double bottom in the TLT 0.00%↑ at the end of August (https://732charts.substack.com/p/double-bottom-in-bonds).
Price has broken through that level this week (though it is positive today) and this weeks closing will become an important piece of information in this story. If it can hold last October’s low, then we might’ve found a bottom, and perhaps more importantly, could be a sign that yield increases may be slowing down. If it can’t hold, I’m looking at price history from 2013 as the guide for the next potential area of interest (black horizontal line). It’s also worth pointing out the bullish RSI divergence above.
One last chart to consider -


