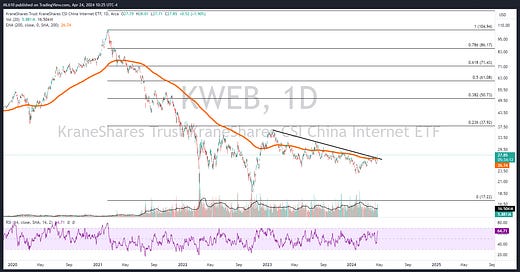
Not a fan of diagonal trendlines, but this one’s coupled with a move through a flattish 200 day moving average, which makes it interesting.
$TCEHY is the ETF’s largest holding and had a similar break recently, while the second largest holding BABA 0.00%↑ remains below a downward sloping 200 day. So a mixed bag which makes this more of a development worth watching vs something incredibly actionable (though playing the 200 day as a downside stop out is an option).


