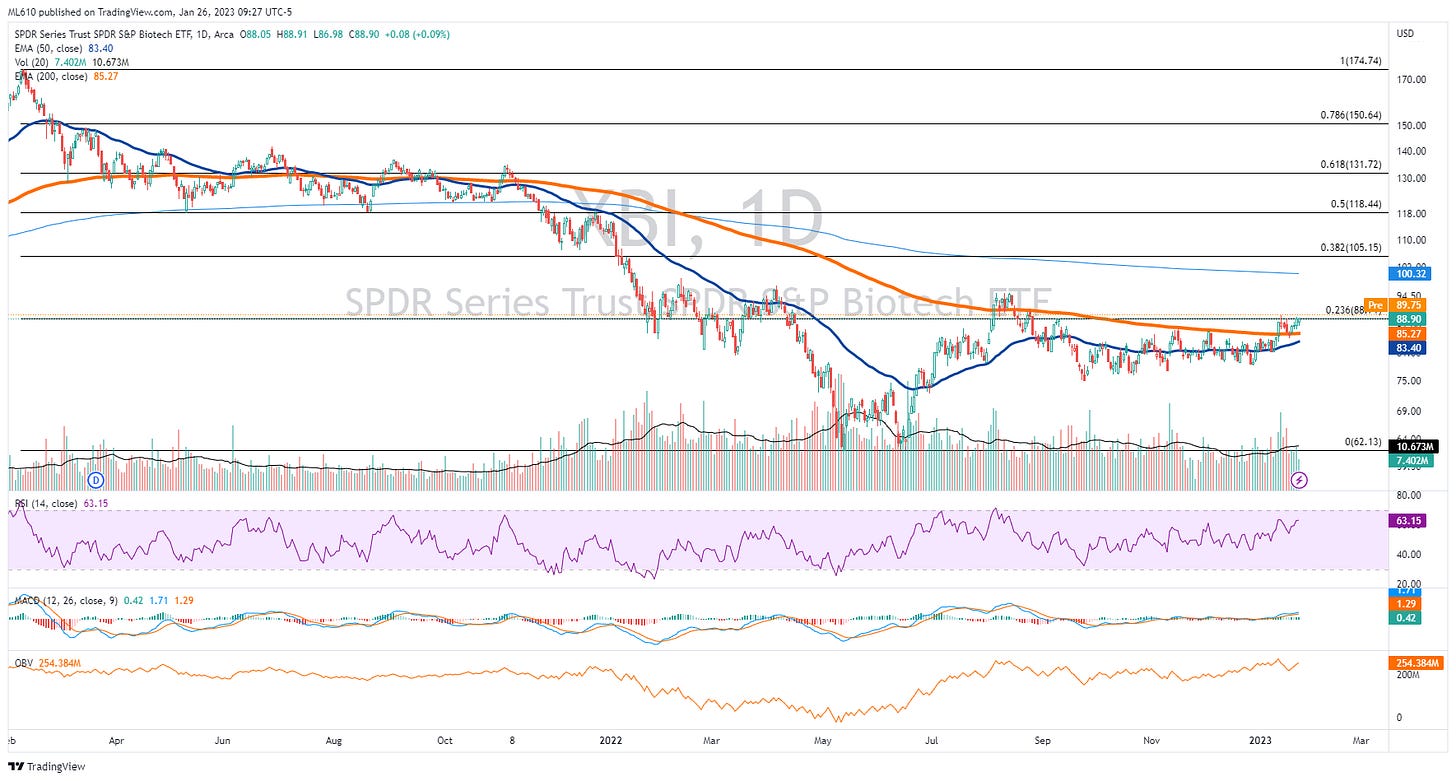
Daily chart of XBI 0.00%↑ , basing above 200 day after a strong volume cross above it. Not dissimilar to August’s move.
XBI 0.00%↑ Monthly - Never oversold, well established bottom range.
My thinking - A play on the long side here, with a stop at the 200 day. A break back down through that would mimic Augusts price action. If not, it could begin a grind back higher.


